Excel · Python · BI · AI agents
One Arrow Flight server feeds them all
EnergyScope is the energy data access layer — the tools that put the data where you work: a native Excel add-in with 77 functions, Flight SQL for Python, ODBC and BI tools, and 65 MCP (Model Context Protocol) tools so your Claude reads the same catalog you do. A full supply-and-demand workbook lands in 200 ms, not 200 seconds of REST calls — and the analyst comes built in: report presets, named signals, forecasts with honest backtests.
Behind the tools: 2.8M series, 21 datasets — browse the catalog → · See the flagship report →
"Generate the monthly oil risk & strategy pack as html — preset monthly_risk with the monthly_risk watchlist. Lead with what changed since the last edition, backtest the pack's own claims, add book risk and the house view with invalidation triggers."
One prompt in Claude Code. One report() call sweeps the pinned 27-series universe (~8s) and emits the canonical snapshot, derived_signals fires the narrative layer, then your Claude Code writes the full pack — decision dashboard, book risk, backtests, revision trail, tool audit.
"The signal layer composed the regime from market data alone — before the narrative arrived."
Every firing contradiction — supply_shock_signature, freight_locked_arb (BWET z=7.92), forced_storage_build, regime_curve_destruction — was downstream of a Strait of Hormuz disruption since February 28. The platform got the WHAT and HOW MUCH right without knowing the WHY. The verifiable part is not this story — it is the public calibration ledger: every scored claim in every report is resolved and Brier-scored after the fact, failures included.
1,000+ series in a single call, not 1,000 separate queries. Under 200ms for a full S&D workbook.
Arrow Flight columnar format + lz4 compression. No JSON serialisation, no parsing overhead. Orders of magnitude faster than REST/JSON.
95% fewer warehouse queries. Data served from intelligent cache with immediate new data checks per user.
Per-user alerts when your series have new data. In Excel, by email, ntfy, or webhook. Based on your query history, it knows what data you care about.
Date-aligned queries, forward-fill, frequency detection, weekly/monthly/annual handling. Built for energy market data patterns.
Analytics ride alongside the data. Spreads, crack margins, forecasts, breakpoints, volatility, cointegration — same server, same call, same API key. Plus CFTC positioning & ICE Brent curve. Your analytics where the data sits. See forecasting →
65 MCP tools. Claude Code searches, forecasts, calculates spreads & crack margins, reads CFTC positioning, runs full market reports — all by natural language. See AI integration →
77 Excel cell functions — data, forecasts, analytics. Python library with pivot, fill, and server presets. Same data, same speed, your choice of tool. See Excel add-in →
12 report presets mapping to the daily/weekly/monthly cycle of a physical oil trading desk. Morning briefing to the monthly risk & strategy pack in one call. See workflows → · View flagship report →
Use our data, your data, or both. Same analytics, same tools, same Claude Code reports.
2.8 million energy series from 21 datasets + 65 MCP tools (data, analytics, narrative layers) + 12 report presets. Your Claude Code generates full oil market intelligence reports. Sign up and go.
Your proprietary data lives in your Snowflake or your Iceberg lake. EnergyScope adds the serving, analytics and narrative layers — same 65 MCP tools, same presets, same Claude Code integration. Your data stays yours.
Save your series once. Use them everywhere.
Saved server-side. Reusable across sessions.
No more re-typing 16 series IDs every call.
Snowflake is a warehouse, not a real-time data service — and an Iceberg lake is files and a catalog, not a serving layer. EnergyScope is the serving layer on top of either.
| Direct Snowflake | EnergyScope | |
|---|---|---|
| 200 series refresh | 200 queries × 2s = 6+ minutes | <200ms (1 batched call) |
| Second refresh | Same cost again | <130ms (memory cache + update check) |
| Wire format | HTTPS / JSON | Arrow IPC + lz4 + batching * |
| Snowflake credits | Every query costs compute | Startup + query-triggered new data checks only. 95% reduction. |
| Warehouse suspended | No data available | Cache still serves |
| New data alert | Manual check | Push notification |
| Search 2.8M series | SQL LIKE, 2-3s + credits | Pre-indexed, <50ms |
| Excel UX | ODBC / Power Query | =ES.Get(), =ES.Table() |
| Analytics | Write your own SQL / Python | 62 server-side MCP tools (forecast, seasonal, crack spread, percentile, arb signal, derived_signals...) |
| Market reports | Manual — hours per report | report(preset="monthly_risk") — one call, ~8 seconds. See demo → |
| Forecast validation | None | Backtest skill vs naive, overfit warnings, ensemble disagreement |
| Positioning / curve / arb | Build your own | Built-in: CFTC percentile, term_structure, arb_signal, seasonal context |
| Claude Code / AI | None | 62-tool MCP server — natural language reports, analysis, forecasts |
* Wire format measured: lz4 compression alone delivers 3.5x reduction (45.7s → 12.9s for 2.8M rows over internet). Combined with query batching (1,391 series in one call vs 1,391 separate queries) and Arrow columnar format (no repeated field names, binary not text), the effective speedup is ~200x for a typical S&D workbook refresh. Benchmarked March 2026 with real US Oil S&D workbooks on EIA petroleum data.
Real US Oil Supply & Demand workbooks — 1,391 EIA petroleum series, 672,019 datapoints, 2000-01-01 to current — 26 years of data.
| Workbook | Series | Rows | Time |
|---|---|---|---|
| Crude S&D | 204 | 83,490 | 86ms |
| Distillates S&D | 539 | 189,024 | 188ms |
| Kerosene S&D | 472 | 184,534 | 131ms |
| Mogas S&D | 654 | 214,971 | 126ms |
| Total | 1,391 | 672,019 | <200ms each |
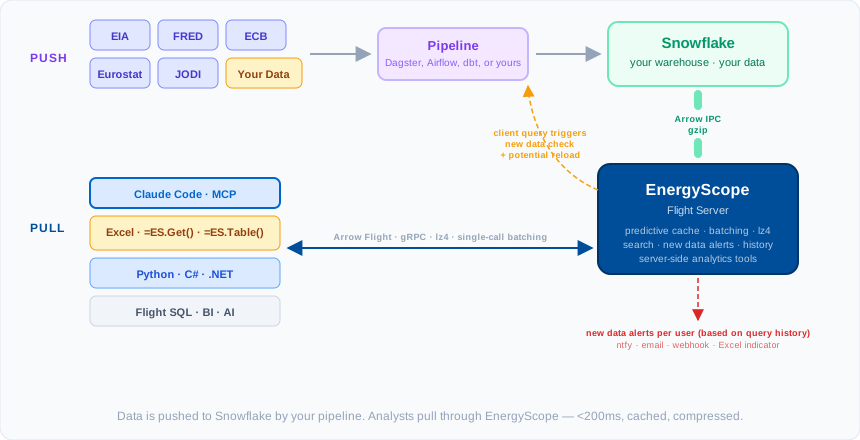
All clients connect via Arrow Flight (gRPC + lz4). Claude Code uses the MCP server — same data, same analytics, natural language.
gRPC transport with columnar Arrow format, lz4 compression, and query batching. 1,000+ series in one call. Orders of magnitude faster than JSON/REST.
=ES.Get(), =ES.Table(), =ES.Latest(), =ES.Search(). Live formulas, not Power Query. Instant refresh. Intelligent data insertion with new data highlighting, revision tracking, and in-ribbon NEW DATA indicator. See all 77 functions →
Save your Python model. Server runs it when new data arrives. Results appear as a queryable series — =ES.Run("my_spread_model"). XGBoost multi-factor forecasts, Prophet, ARIMA, Theta, GARCH volatility, breakpoint detection, custom S&D balances — 48 built-in functions plus your own. See forecasting →
Browser-style per-user history. Pre-fetches your series before you ask. Rapid checks for new values automatically for the specific series used by each user. Serves from memory even when Snowflake is suspended.
Data source publishes. EnergyScope detects it, reloads, notifies your Excel. Per-user, per-series. No manual checking.
Data corrections tracked with timestamps. Know when a value changed and what it was before. Essential for backtesting.
One Snowflake load plus lightweight update checks. One cache serves the whole desk, not 20 analysts × 5 refreshes × 200 series.
Structured .md files and MCP server let Claude Code, Copilot, or any AI assistant discover and query 2.8M series by natural language.
Your data in your Snowflake or your Iceberg lake. Licensed EnergyScope software runs on your servers. Connects to your warehouse or lake, caches your data, serves your analysts. Your data never leaves your network.
2.8M energy series from EIA, FRED, ECB, Eurostat, JODI, OPEC MOMR, IEA OMR, UN Comtrade and more. We host the data. You query it. Excel add-in, Python, C#, or any Arrow Flight client. Sign up, get an API key, start querying. Nothing to install or manage.
EnergyScope delivers energy market data via Arrow Flight — the fastest columnar transport protocol. Use our Python library, Excel add-in, HTTP API, or connect via Flight SQL.
"Generate the monthly oil risk & strategy pack as html — preset monthly_risk with the monthly_risk watchlist. Lead with what changed since the last edition, backtest the pack's own claims, add book risk and the house view with invalidation triggers."
One prompt in Claude Code. One report() call sweeps the pinned 27-series universe (~8s) and emits the canonical snapshot, derived_signals fires the narrative layer, then your Claude Code writes the full pack — decision dashboard, book risk, backtests, revision trail, tool audit.
Everything on this site runs against a live catalog built from public sources — 21 datasets, 2.8 million series, updated daily, queryable from one interface. It exists to prove the tools at scale. The deployment that matters is yours: the same access layer pointed at your own data, in your own Snowflake or Iceberg lake — nothing leaves your infrastructure.
| Source | Datasets | Series | Datapoints | Frequency |
|---|---|---|---|---|
| EIA | PET, ELEC, NG, INTL, PET_IMPORTS, STEO | 1,099,000+ | 80M+ | D / W / M / A |
| Eurostat | Energy balances, prices, supply, trade, stocks, renewables (EU27) | 1,710,137 | 54.3M | M / A |
| JODI | Oil supply & demand by country | 3,327 | 542K | M |
| ECB | FX rates (19 currencies) | 38 | 138K | D / M |
| FRED | WTI, Brent, Henry Hub, CPI, rates | 14 | 73K | D / M |
| World Bank | GDP, energy use, resources | 100 | 3K | A |
| Baker Hughes | Rig counts (US, Canada) | 14 | 31 | W / M / A |
| CFTC | Managed money positioning (WTI, Brent, NG, ULSD, RBOB) | 45 | 3K | W |
| ICE / Yahoo | Brent futures curve (M1–M12 + dated contracts) | 24 | 12K | D |
| Yahoo Finance | SHIP (tanker), OILEQ (oil equities), MACRO (rates/FX/metals), GAS (LNG/E&P incl. TTF front-month) | 46 | 57K | D |
| OPEC MOMR | World S&D balance, MoM revisions, rig count, DoC crude production by country (secondary + direct) | 385 | 1.6K | A / Q / M (monthly release) |
| IEA OMR | World oil supply & demand balance + MoM revisions (Table 1/1a) | 150 | 1.2K | A / Q (monthly release) |
| UN Comtrade | China crude imports by origin country (HS 2709, 2016–2024) | 142 | 7K | M |
Browse the demo catalog → · Point it at your own data instead →
Access 2.8M energy series via API. Excel add-in and Python library included.
Licensed Flight server for your Snowflake or Iceberg lake. Deploy on your infrastructure.
"Exemplary… Really astonished after seeing your work." — Cargill, 2023
EnergyScope is built and operated end to end by one engineer — David Linton, 15 years on data-intensive systems for Cargill, Deutsche Bank, Louis Dreyfus and UBS. Those years taught one lesson, and this platform is the answer to it:
The data was never the problem — getting it into the analyst's hands was. So that is what this is: the tools that deliver data.
The plumbing is public where it can be: the generic client toolkit lives at sparrowflight.io, with an upstream fix merged into Apache Arrow and the first .NET reader for the Vortex columnar format. The energy data here is the proving ground. The tools are the product.
Excel, Python, and Claude Code — one free API key puts 2.8 million series behind all three.